Gold often has its own reasons to rise or fall. Still, it’s not just mountain dwarves who want large stockpiles of gold for when times are tough. @JONOGG
Gold is one of the top commodities with a 32.5% year-to-date gain in 2024. Gold was just $2,000 per ounce a year ago and now it has challenged $2,750. Central banks, investors, collectors, jewelers and certain industries all want or need gold for many different reasons. Many “gold bugs” believe that $3,000 gold is coming. If gold miners are really a leveraged way to invest in the gold boom, this has to be a boom for gold miners right? Not so fast.
The week of October 25, 2024 brought some devastating news for the gold mining sector after Newmont Mining Corp. (NYSE: NEM) stock had a huge loss after earnings. Its disappointment was worse than the $0.81 EPS reported on $4.61 billion in revenues being short of the $0.86 EPS and $4.67 billion in revenues er analysts’ expectations. Newmont delivered 2.1 million gold equivalent ounces and generated $760 million in free cash flow. The company is touting asset sales, a Tier-One asset focus and a return of capital to shareholders. But…
Two other issues initially stood out. Quarterly capital spending (net of accruals) rose to $877 million from $604 million a year earlier. Newmont’s average price of gold realized was $2,518/ounce from $1,920/ounce a year ago. If the price of gold is surging it should more than mask some excess spending. And there should be a lot of room to absorb operating costs rising from wages to environmental to regulatory costs.
And then the real problem surfaced. It turns out that having a red-hot commodity to sell is a problem when your costs look so much higher.
Newmont’s forecast for its fourth quarter is on track for attributable gold production of 1.8 million ounces and with an all-in sustaining cost (AISC) of $1,475/ounce. Newmont’s Fiscal Year 2024 AISC was $1,444 per ounce, and the $1,537 YTD cost (AISC) with another quarter at $1,475 (after $1,611 in Q3).
Now the question begs what happens if the AISC is actually higher without being able to be lowered?
NEWMONT’S PLUNGE HURT GOLD RIVALS
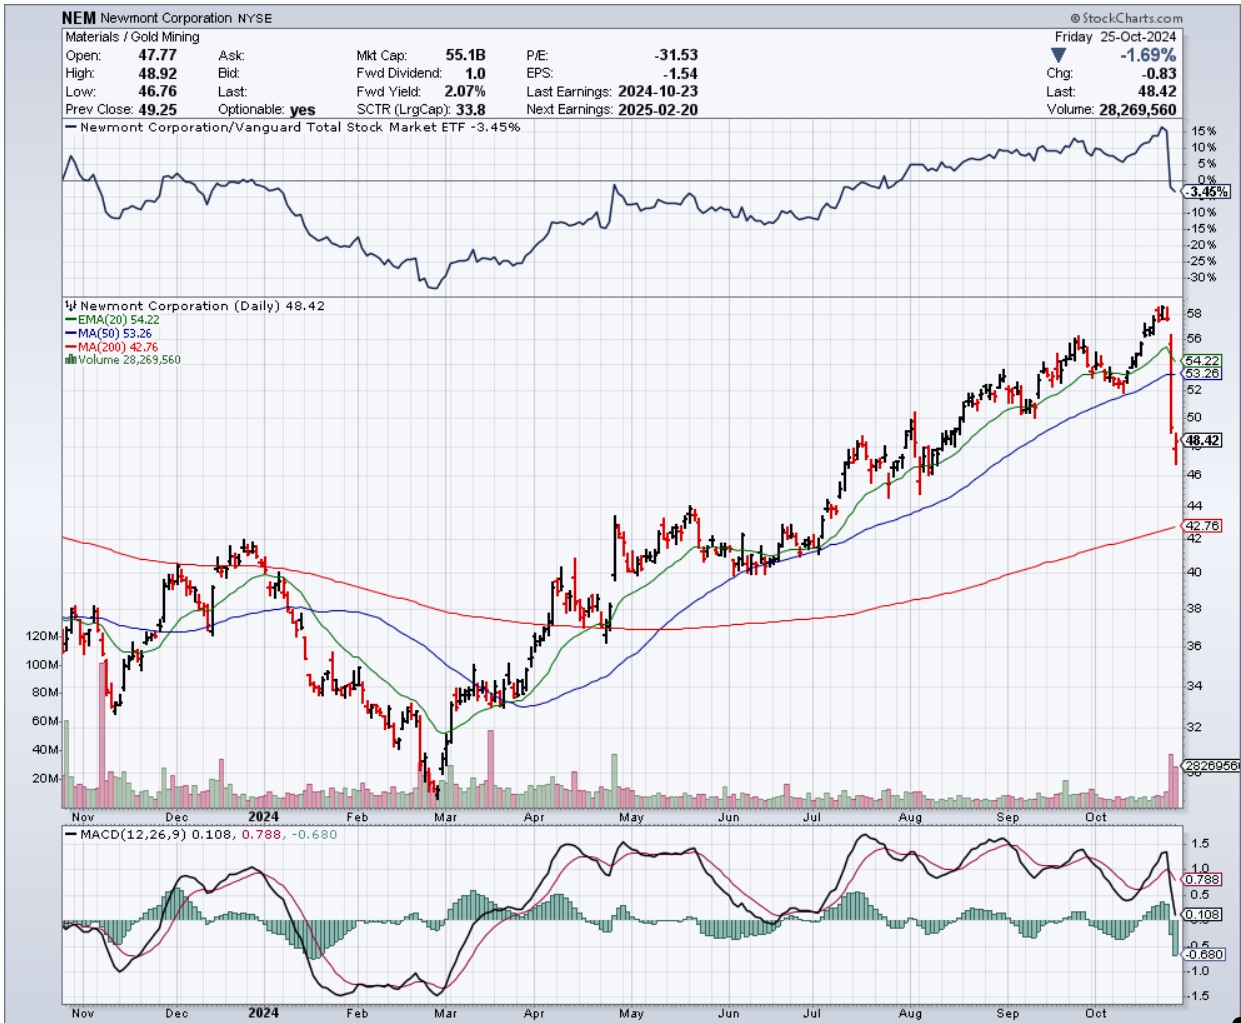
Newmont’s stock price was up to $58.68 ahead of its earnings report versus $$52 at the start of September. Expectations were strong for Newmont with all of the $3,000 gold price calls that have been made. Then Newmont shares fell well over 14% to $49.25 for its largest one-day price drop in years. And then on Friday Newmont fell another 1.7% to $48.42.
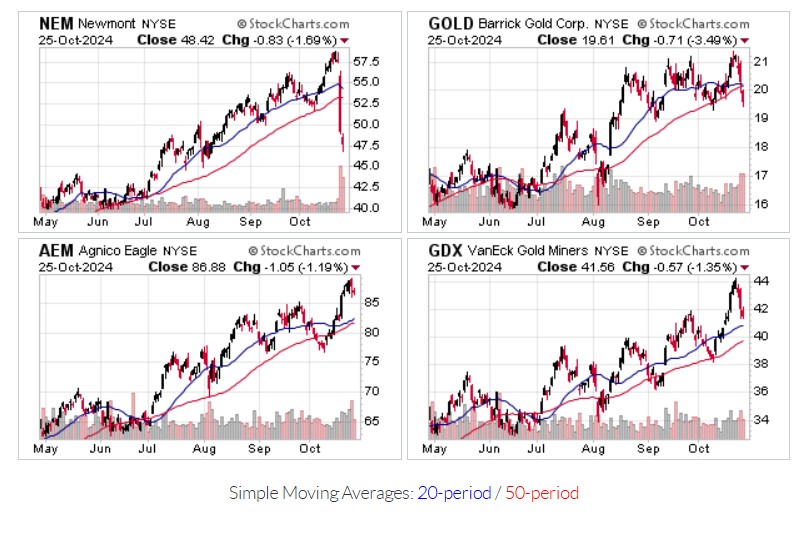
Barrick Gold Corporation (NYSE: GOLD) fell from $20.80 down 2.3% to $20.32 on Thursday’s reaction to Newmont, but then Friday’s drop was down a harsher 3.5% to $19.61.
As Newmont and Barrick dominate the gold miner ETFs, the prized VanEck Gold Miners ETF (NYSEArca: GDX) went from $43.26 down to $42.13 on Thursday and then down to $41.56 on Friday. That was an index ETF loss of 4% from just two trading sessions.
Agnico Eagle Mines Limited (NYSE: AEM) is one of the top components with the “GDX” and its 1.2% drop to $86.88 on Friday was down from $88.61 ahead of Newmont’s earnings. AEM’s relative drop was only 2% over the same time period.
Charts for each of these have been added at the end for a review.
FRESH ANALYST CALLS
A BofA Securities report (Buy and $68 price target after earnings) noted that the higher AISC was driven by higher contract services and increased sustaining capex. Its focus remains on asset sales and capital returns to shareholders to drive the stock back up. The firm’s target of $68 is based on a valuation of 2-times net asset value — up from 1.5 currently, but below the 2.5-times multiplier from the great gold rally of 2011. And BofA’s logic for $3,000 gold is different than many others.
CFRA reiterated its Strong Buy rating and a $68 target noting that AISC may come down as it moves just to focus on Tier 1 assets and sell off non-core assets.
Morningstar has a hold rating and cut its price target down by 4% to $50 on Newmont. While benefitting from strong gold prices, it sees volumes likely to be lower than expected. It also forecasts AISC to be around $1,560 (before byproduct credits) versus $1,590.
Raymond James remained positive by reiterating its Outperform rating and even raising its target to $66 from $65.
RBC maintained its Sector Perform rating after earnings and cut its target to $53 from $54.
Scotiabank downgraded Newmont to Sector Perform from Outperform and the firm cut its target to $55 from $59.
PRIOR CALLS WERE ALL ONE-WAY — UP & UP!
Analysts had been handily raising price targets on Newmont in the weeks ahead of Newmont’s report, some of which you will see listed twice because analysts issued more than one report and price hike. These were the hikes starting in June and July and then more recently until shortly before earnings:
- UBS ($67 from $65)
- Jefferies ($63 from $54)
- UBS ($65 from $50)
- Argus (raised to Buy $58)
- Scotia ($59 from $48)
- BMO $57 from $56
- Jefferies ($54 from $50)
- CIBC ($61 from $46)
- BofA ($50 from $49)
- UBS ($50 from $40)
DISCLAIMER
Tactical Bulls is not offering investment advice here in this report nor does it have formal price targets and/or ratings on these or other gold mining outfits. The information provided here in not intended to be investment advice nor is it a recommendation to buy or sell any of the securities mentioned. All decisions to buy, sell or hold are the decision of each investor. Because of risks and other factors that can result in losses, all investing decisions should be made with a financial advisor.
NEWMONT CHART WOES
The chart below from StockCharts.com represents a crushing blow to significant gains from the top gold miner. If you look, it’s worse than just falling from $58 to $48. This wiped out about four months’ worth of gains, also blowing through the 20-day and 50-day moving averages. Whether this means that the ultimate long-term challenge of the 200-day moving average is coming remains to be seen. If that becomes the case, then this is even a worse representation than what we saw in recent trading sessions. A second set of more brief charts has been included for Barrick, the “GDX” ETF and for Agnico Eagle Mines.

Courtesy of StockCharts.com

Courtesy of StockCharts.com
Categories: Investing