The Federal Reserve’s FOMC finally got around to cutting interest rates by 50 basis points in September. It is, or was, supposed to be the first of multiple interest rate cuts. Now interest rates on the long end of the Treasury yield curve have risen rather than continued falling. Is this market mechanics, or is something more sinister at work?
The easy argument for rates having risen is simple market mechanics. After all, the Fed is still holding on to being “data dependent” for the most part and economic readings have been stronger than expected since mid-September. And for the yield curve to steepen, it means that longer-dated yields had more room to rise while short-term rates continue to slowly fall.
Arguing the more sinister scenario is always up for debate, but the case is growing that long-term investors are closer now than ever before to having to worry. This is also a side of the coin that all investors need to understand, even if they ultimately do not agree that it will ever evolve.
Tactical Bulls is not making any absolute interest rate forecasts nor any end of the world economic forecasts here. That said, the market does still have some justifiable concerns that need to be kept in mind. And also keep in mind that, as of October 24, we still have not even seen any of the election mayhem yet.
This marks a different tone from the “last chance to buy 4% yields” from August. As market conditions change the outlook (or worries) can change too.
THE MECHANICAL EXPLANATION
The first issue for rising long-term rates is just that economic data since the Fed’s first interest rate cut has come in stronger than expected. Retail spending, much higher jobs data, and corporate earnings are holding up. Even GDP expectations have remained around 3%. At the start of September there were many more calls for a recession than there are presently.
Another issue is that the bond market had already been factoring in rate cuts long before the rate cut finally came. It was just in Q4-2023 that the 10-year Treasury note was almost showing a 5% yield. That means that by the time the rate cut came a month ago the 10-year Treasury’s yield had already dropped by more than 125 basis points from peak to trough. Markets usually overshoot on the upside and the downside.
And future rate cuts? Stronger growth, and certainly higher prices, would make the case that aggressive rate-cutting ahead may need to have tempered expectations. It is quite possible in the Fed’s “data dependency” that the hope of Fed Funds being back at 3% or so (4.75% to 5.00% now) by the end of 2025 is just too aggressive to bank on.
The extreme readings in the 10-year Treasury went from under 3.65% to just over 4.25% in about a five-week period. Even then, consider that this is still down from nearly 5% just about a year ago. Short-term rates may not come down as fast as we were all hoping just a month ago, and if the yield curve is not going to remain inverted then it would be achieved by long-term rates rising a bit more.
A MORE SINISTER EXPLANATION
Does sinister have to mean evil? No, but it might be scary nonetheless. Even two or three years ago the prevailing thought was that the more sinister scenario wasn’t supposed to be a risk for nearly a decade. This involves the U.S. addiction to deficit spending on top of the U.S. Treasury’s outstanding debt spiraling out of control. This is when the crushing debt servicing costs having reached unacceptable levels. The problem today is that debt servicing is now too high. Actually, it’s way too high.
Did you know that BofA recently noted in a $3,000 gold commentary that one reason is that gold may ultimately be safer than Treasuries? It sounds like an extreme view, at least until you overlay four to six more years of the current deficit spending on top of the current math.
The U.S. Treasury’s “debt to the penny” site has now crossed above the $35.8 trillion mark. Maybe this sounds like just another big number that economists tout. But… The U.S. government is chewing through each new $1 trillion in debt like stoners with an endless bag of chips. And additional concern about the most recent surge in Treasury debt is that it’s not being given any proper explanation. To prove the point even further, this explosion of debt in recent weeks looks like it is the quickest rise of debt ever seen outside of any economic crisis period.
DEFICITS & DEFICIT SPENDING
Everyone hates deficits right? At least right up until the government stops spending into the economy. The Congressional Budget Office deficit forecast from this summer was that the $2.0 trillion deficit in 2024 will grow to $2.8 trillion by 2034. The U.S. government just took in record tax revenues and it is still spending handily above its means with what was just supposed to be a formal $1.8 trillion deficit for 2024. And if the last $500 billion growth in debt (Sept.3 to Oct. 22) were to remain static, then this official forecast is underestimated and undercalculated massively. The U.S. could be looking at a $3 trillion deficit sooner rather than later.
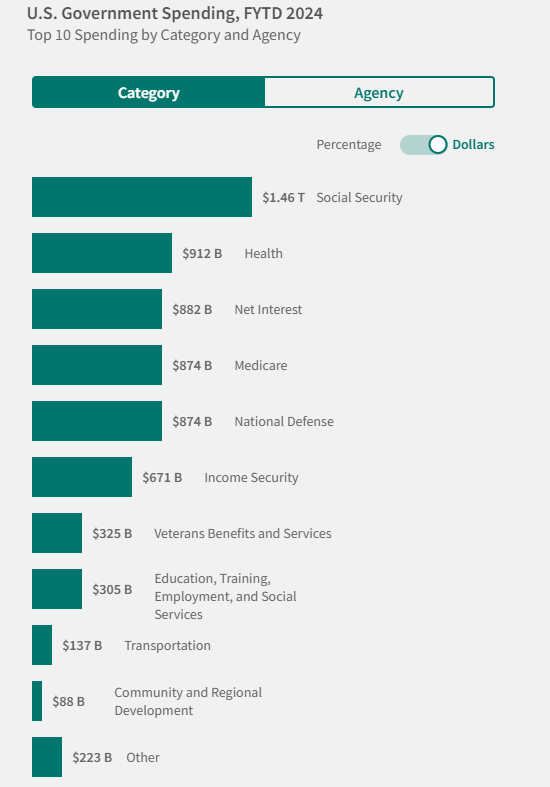
Now for the worst part in debt servicing costs. The government’s budget is generally static on spending items, but we have already hit $1.1 trillion for annual debt servicing costs. This is how much interest the Treasury has to pay each year just to fund its bills, notes and bonds.
If the government paid over $1 trillion when the total Treasury deficit was $34 trillion, and now it is a $1.1 trillion annual debt servicing cost, what happens after $36 trillion at say $40 trillion in a couple more years? And what if interest rates do not come down to make that debt servicing more affordable?
The chart below from the Treasury shows how much each item is in dollar terms. You will notice that debt servicing is now far more of the pie that it was just when the 2024 budget summary was shown.

At the present date, all fixed Treasury yields (except 3.99% on the 3-Year) are 4.01% to 4.73%. Let’s just magically flatline this out to when the U.S. Total debt is $40 trillion and assume an average 4% on all Treasury yields. That would equate to $1.6 trillion in normalized annual interest expenses on a static basis. If the yields were back down to 2% or 3%, then a $40 trillion total debt would come with debt servicing costs of $800 billion to $1.2 trillion on a static and normalized basis (after the higher yields already locked in for years revert to then-current rates).
AND FINALLY…
In an effort to keep this from being a dissertation rooted in fear, the issues not being addressed are:
- risks to U.S. dollar as reserve currency
- foreign governments not wanting U.S. Treasury’s fiscal risks
- gold viewed as international “safest haven”
- bitcoin’s continued rise to a “safer haven”
- political rhetoric and national divide
- and ultimately what happens after the debt spiral breaks the machine.
Just do not ignore that those other issues are already being discussed by many investors, many of them famous and well-known investors as well. It would be easy to suggest that since things have always worked out in the past so they must work out in the future. And maybe that will ultimately be the case. At what cost and how that all actually plays out remains to be seen.