Tactical Bulls has been tracking the broad equity market gains since election day. While some gains have been more than impressive, the reality is that the gains are far from universal. Some themes and sectors are doing quite well while others have been getting hit hard.
Some themes and sectors may have been overlooked or missed as a review of this sort cannot capture every single theme. The screen was using the Finviz 1-month performance metrics. This tracked bonds, major equity ETFs, strategies, sectors, foreign/global and even thematic strategies.
Keep in mind that every major firm’s market strategist has already lifted their 2025 price target forecasts for the S&P 500 over the last two weeks. No additional commentary has been added for each sector broken down by themes and these are not in any particular order. The indexes or themes in ETFs with negative performance in the last month have been highlighted in red.
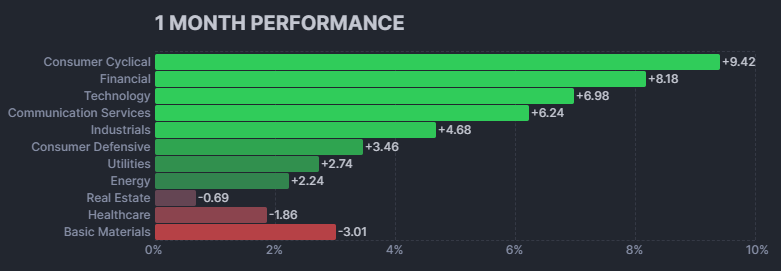
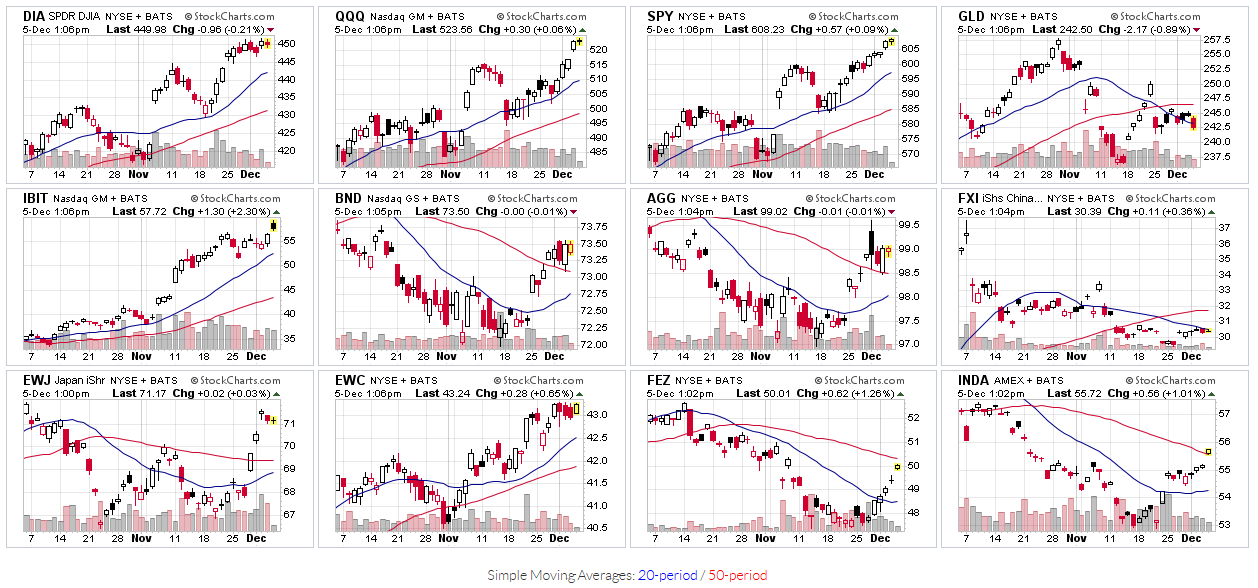
The first graphic is from Finviz and a selection of top ETF charts has been added below from the StockCharts.com website.

BONDS
$BND +0.57%
$AGG +0.56%
MAJOR STOCK INDEXES
Dow – $DIA +6.56%
NASDAQ 100 – $QQQ +6.15%
S&P 500 – $SPY +5.24%
Total Market – $VTI +5.87%
Russell 2K – $IWM +6.81%
Small-Cap – $IJR +6.71%
STRATEGIES
Equal-Weight S&P500 – $RSP +3.96%
Value – $VTV +3.11%
Dividend Appreciation – $VIG +3.31%
Dividend Aristocrats – $NOBL +1.54%
SECTORS
Financials – XLF +8.2%
Communications – $XLC +7.67%
Technology – $XLK +5.94%
Consumer Staples – $XLP +2.08%
Consumer Discretionary – $XLY +12.49%
Aero/Defense – $ITA +4.61%
Industrials – $XLI +4.02%
Utilities – $XLU +3.21%
Energy – $XLE +2.62%
Real Estate – $XLRE -0.50%
Materials – $XLB -1.82%
Healthcare – $IYH -1.89%
FOREIGN MARKETS
China – $FXI -6.77%
Japan – $EWJ +3.03%
Canada – $EWC +4.42%
Mexico – $EWW +0.06%
India – $INDA +1.73%
Europe/50 – $FEZ -1.61%
Germany – $EWG +1.60%
U.K. – $EWU +0.32%
France – $EWQ -4.38%
Italy – $EWI -1.80%
Spain – $EWP -2.31%
Australia – $EWA +0.64%
Israel – $EIS +11.07%
Saudi Arabia – $KSA -0.39%
Turkey – $TUR +14.93%
Africa/Index – $AFK -1.73%
Brazil – $EWZ -7.32%
ALTERNATIVE ASSETS
Bitcoin – $IBIT +46.2%
Gold – $GLD -3.73%
Silver – $SLV -4.49%
THEMATIC ETFs
Republican Stocks – $KRUZ +5.33%
Democrat Stocks – $NANC +6.66%
Buybacks – $PKW +7.15%
AI/Robotics – $RBOT +6.78%
Robotics/Automation – $ROBO +3.23%
Autonomous – $ARKQ +22.8%
Semiconductors – $SMH +0.75%
Semiconductors – $SOXX -0.76%
Space – $ARKX +18.29%
Biotech – $XBI -2.31%
Water/Infra – $PHO +1.43%
Lithium – $LIT -4.11%
Lithium Miners – $ILIT -12.08%
Clean Energy – $PBW -0.05%
Mary Jane – $MJ -24.55%
Post-IPO – $IPO +3.63%
Solar – $TAN -14.62%
Wind – $FAN -6.11%
Gold Miners – $GDX -6.97%
The following charts are a CandleGlance representation from the StockCharts.com site for 12 of the more active ETFs. These are actually 2-month performance charts to show how these were doing a month ahead of the election and how they have performed since. The lines represent 20-day and 50-day moving averages.

Courtesy of StockCharts.com